Type the outline, get the diagram: a whiteboard for people who can't draw
Most diagrams in a small company start as a list somebody typed in a chat. draw.biz59.net takes that list as it is, indented with two spaces, and lays out the mind map, fishbone, swimlane or architecture drawing for you. Here is how it works, with screenshots of the real board, and where it stops.
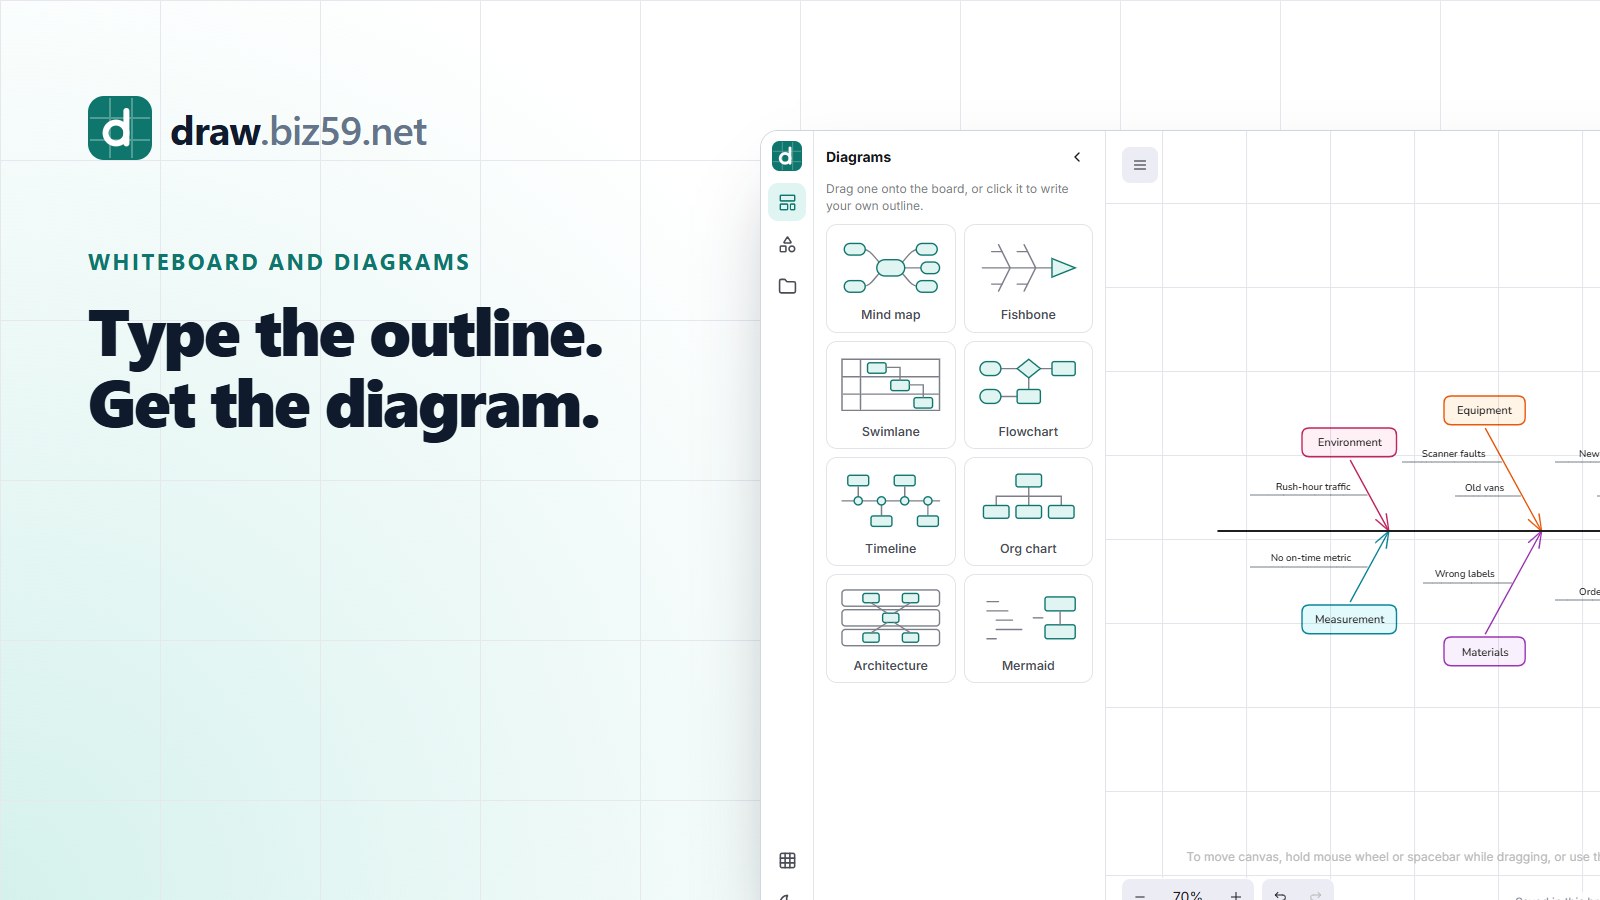
There's a meeting most teams have had. Deliveries are late, or sign-ups dropped, and someone says "let's map out the causes". A whiteboard tool gets opened. Twenty minutes later there are eleven boxes, four of them the wrong size, and the conversation has become about arrows.
The thinking was never the hard part. Somebody could have typed the causes as a list in two minutes. The drawing is what ate the meeting.
That's the idea behind draw.biz59.net, a board we built and put online this month. You can sketch on it freely, like on any whiteboard. But you can also type the list and let it do the layout.
The board
It opens straight onto a blank board. No account, no tour. The drawing tools stand in a strip down the right edge, where a right-handed person keeps their pens. The left side holds the things you drag in: eight kinds of diagram, and an icon library.
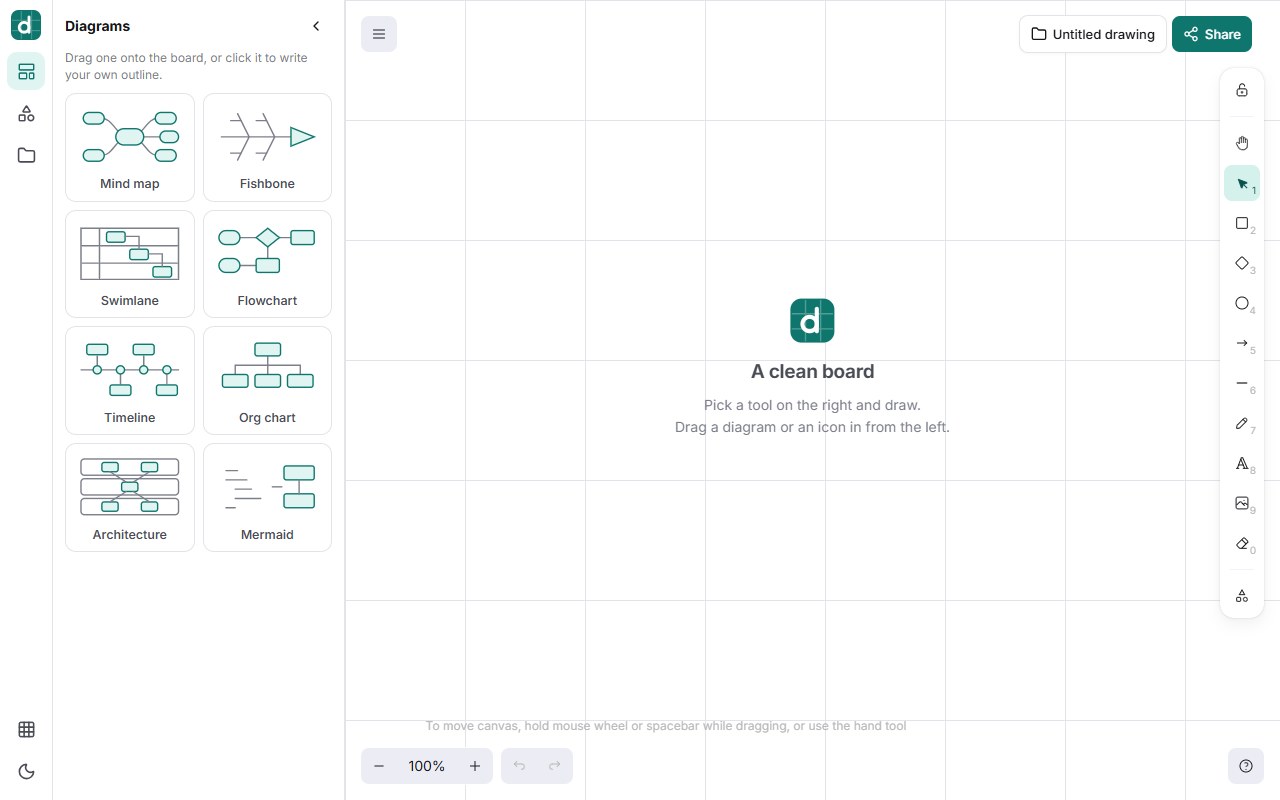
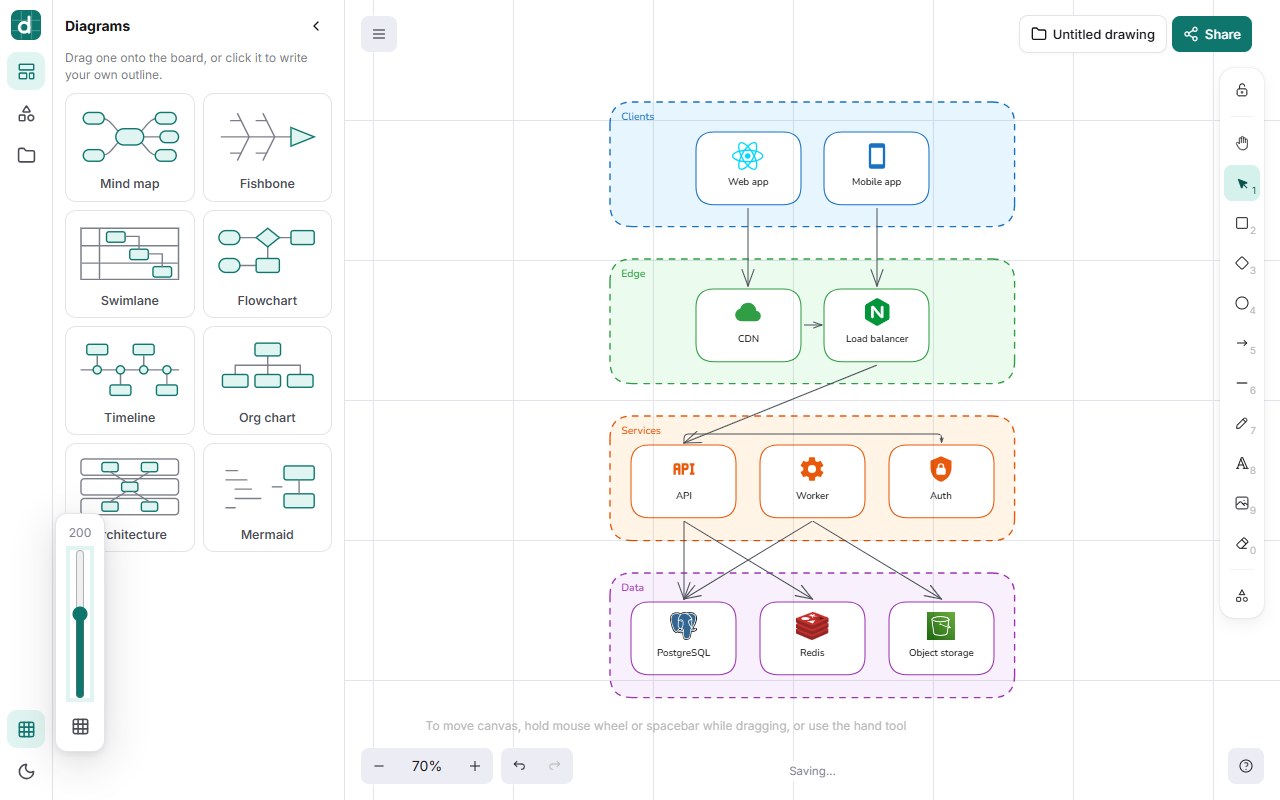
Behind everything is a grid of large, pale squares. It's there to help your eye line things up, and it doesn't snap or get in the way. The grid button at the bottom left works like a volume control: a slider for the size of the squares, and a button to switch it off.
From a list to a fishbone
Click a diagram card and a box opens with an example outline already in it. This is the fishbone, the cause-and-effect diagram Kaoru Ishikawa made popular in Japanese factories in the 1960s. The first line is the problem. Lines indented once are the categories. Lines indented twice are the causes.
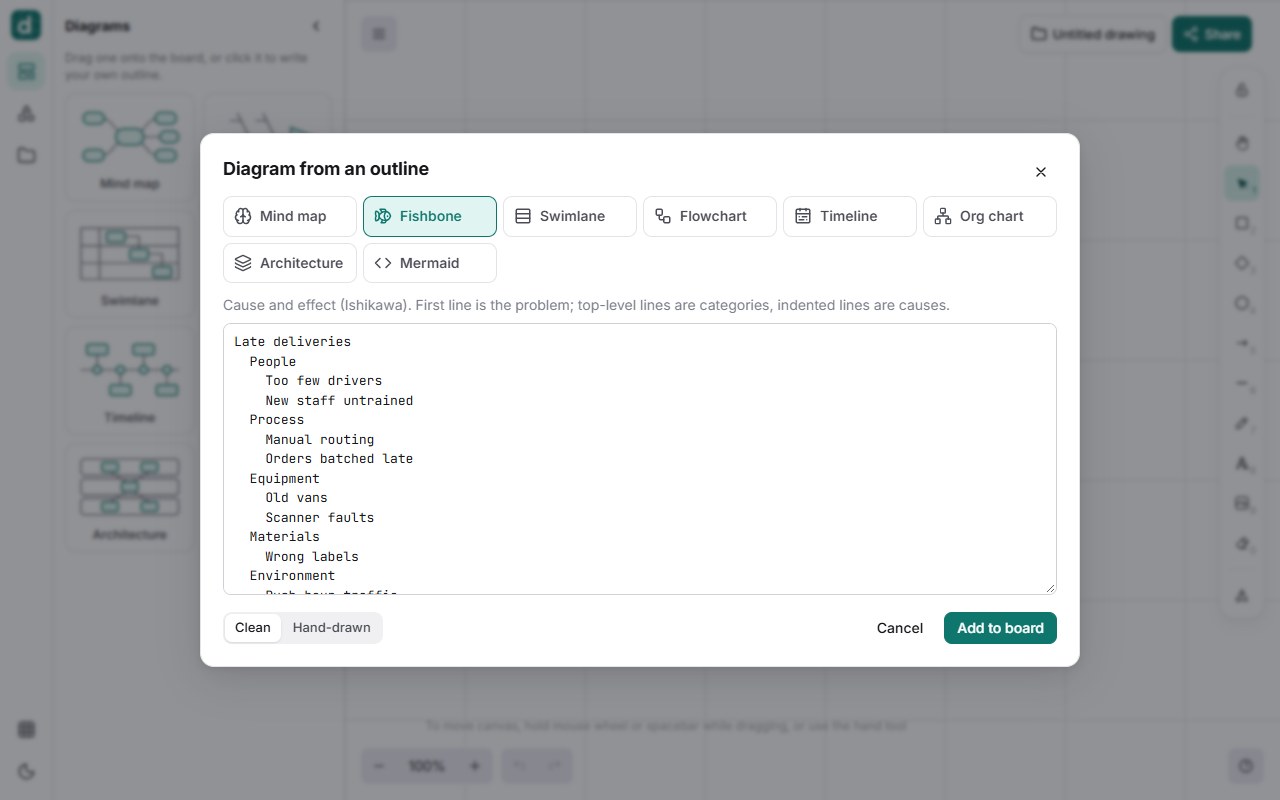
Press Add to board and the drawing appears: the spine, a bone per category, the causes hanging off each one, colours assigned.
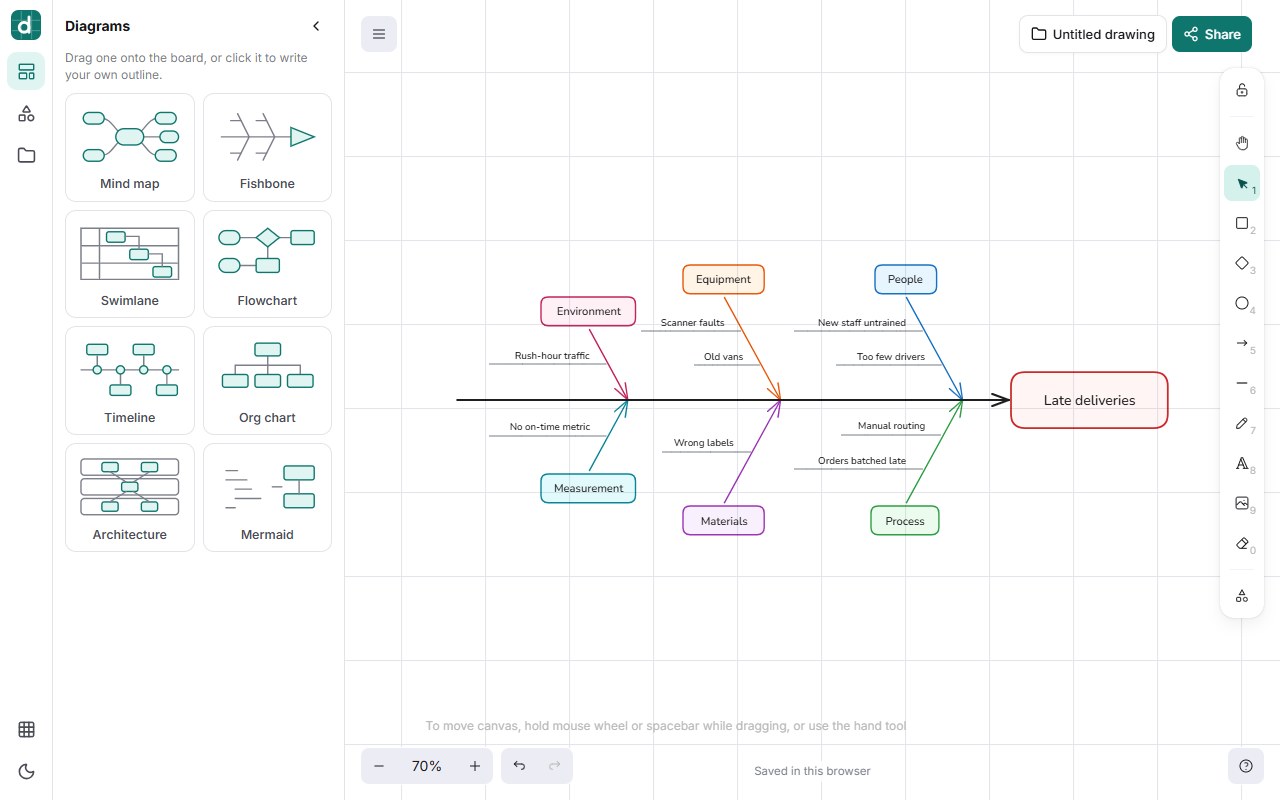
What matters is what you get back. These are ordinary shapes, not a picture. Move a cause to another bone, change a word, delete a category nobody believes in. When the list changes a lot, it's often quicker to fix the text and add the diagram again.
The other types read the same kind of text. A mind map and an org chart take the same indented outline. A swimlane takes one step per line as Lane: step. A flowchart takes A -> B -> C, with a question mark for a decision. A timeline takes when: what. If you already write Mermaid, there's a card for that too.
Architecture diagrams, with real icons
The type we use most ourselves is the architecture diagram. Top-level lines are tiers, indented lines are the parts inside, and a name in square brackets picks an icon:
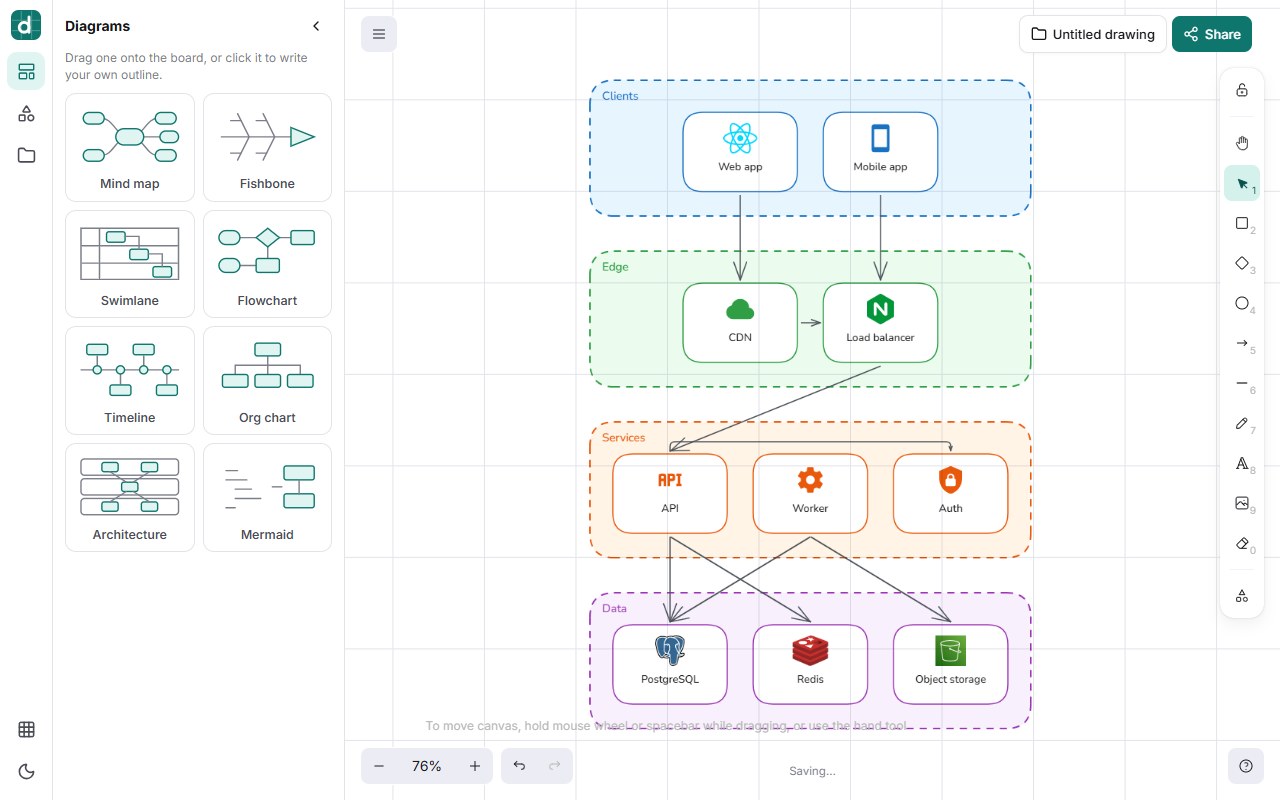
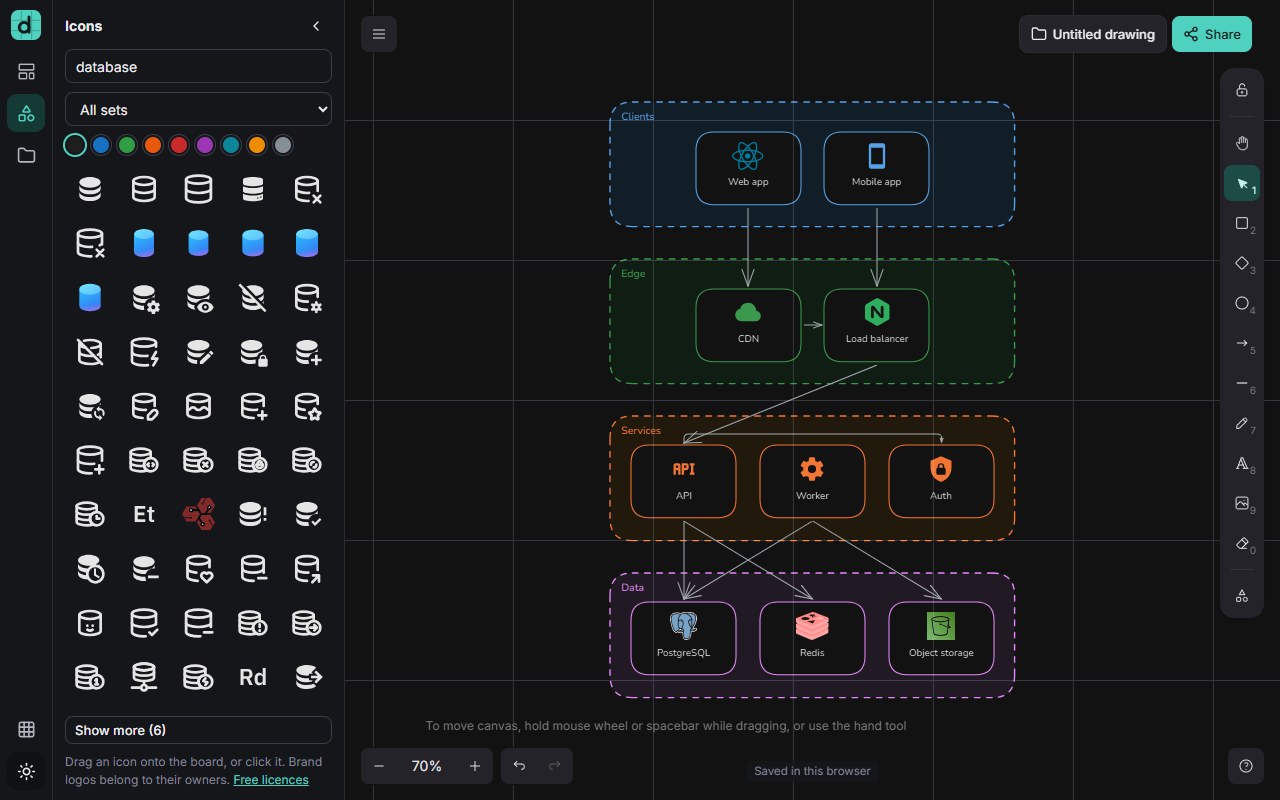
The library has 36,921 icons, and every set in it is under an MIT, Apache 2.0, ISC or CC0 licence, so you can use the drawing in a client deck without reading terms. The list of sets and licences is on the site. Brand logos still belong to their owners, of course. You search across all the sets at once, or pick an industry (healthcare, logistics, energy, retail and sixteen more), and drag an icon onto the board.
Where it stops
It would be easy to oversell this, so here is what it isn't.
It doesn't think for you. The layout is mechanical. A fishbone with forty causes will be laid out faithfully and will still be a bad fishbone.
It isn't a multiplayer room. You can share a link that shows the drawing and follows your changes, and that's view-only. Two people can't draw on the same board at the same moment. If live workshops with twenty cursors are what you need, the big whiteboard products do that well.
Layouts are simple on purpose. Tiers go top to bottom, timelines left to right. For a wiring diagram with strict rules you'll want a specialist tool.
Without an account, drawings live in your browser. That's fine for a quick sketch and risky for anything you'd miss. Signing in with an email code keeps them in an account and is what makes sharing possible.
Bots can draw too
Because the input is plain text, a script or an AI agent can make a diagram by sending the same outline through the API or the MCP server. The agent writes a list, which is what language models are good at, and a person opens a proper, editable drawing. The calls are in the API and MCP docs.
Export is PNG, SVG or PDF. The same account works on md.biz59.net, our markdown notes tool, if you want the words next to the picture.
Open the board and click a diagram card. The example outline is already there to edit.
Open draw.biz59.netSources
Ishikawa diagram, Wikipedia, for the history of the fishbone. Mermaid, the diagram text format the Mermaid card reads. Icon sets and their licences: draw.biz59.net/licenses. Screenshots were taken on the live site on 14 October 2026.